Doing image analysis is very nice, but of course you also need to keep track of your data and the measurements you have done. Using the OMERO plugin in FIJI allows you to connect to your data in OMERO and measurements done in Fiji can be directly linked to your analyzed images.
Let’s make a simple measurement: measure the length of zebrafish larvae.
1. Connect to OMERO
Connect to Omero-test server using OMERO plugin in fiji: Go to Plugins > OMERO > Connect to OMERO. Make sure the server address is omero-t.services.universiteitleiden.nl, and log in.
2. Navigate to the data
Go to the folder general training > rohola hosseini > Demo_project_zebrfish_datasets > Michiel_DMSO nt
Double click on one of the pictures to open the file in FIJI.
3. Configure measurements
Go to Analyze > Set measurements and disable everything.
4. Select line tool
Select the line tool in the FIJI main tool bar.
5. Make it a segmented line
Right click to make it a segmented line.
6. Draw the measurement
Left click to start the measurement, right click to end the line.
7. Measure the fish
Select the length of the fish.
8. Get the measurement
Press M for measure (you’ll get the length of the fish).
9. Add to ROI manager
Press T to add the line to the ROI manager (region of interest).
10. Create bounding box
Use Edit > Selection > To bounding box to create a rectangular ROI from the line drawn, this will be used later.
11. Save to OMERO
Go to Plugins > OMERO > Save results to OMERO and tick both the ROI and measurements box.
12. Name your save
Save the measurement with your name.
Verify in OMERO.web
Now go to https://
Check attachments
Under attachments you can now find your measurements.
View ROIs
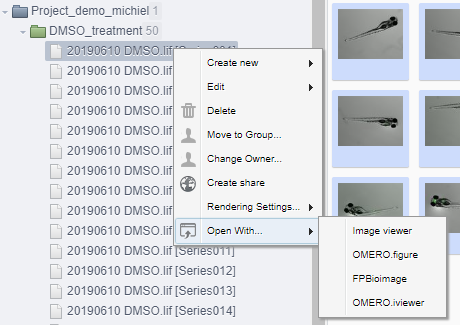
If you right click in the left folder structure on the image you can open it with omero iviewer.
Once opened you can go to the ROIs tab and display the ROI you have created.
Quick figure option
You can also use this to easily create figures, if you open it with OMERO.figure (see 2nd option above).
Once you click this you’ll get the complete image
Copy and paste the figure
Select the bottom one, and go to preview > Crop, select the ROI from OMERO and press OK
On the bottom image press labels, and in the ROI menu press edit. Press load rois to load the saved rois and select the one you want to display