OMERO-web has a nice feature, called OMERO.figure. You can open one or multiple images from OMERO with OMERO.figure and create your own publication ready figure and export it as a pdf, tiff or png file. The images in this file are also linked to the images used in OMERO, so you can easily find back the original image if you need to make changes to your figure.
In this exercise we will create a multi-panel figure that can serve in a PowerPoint for presenting the data to your group/supervisor or for a publication.
Select images
From the dataset in part 3 choose your favorite 4 zebrafish larvae images (you can select multiple with ctrl+click).
1. Open with OMERO.figure
Right-click on one of the selected files in the list of files. And click Open With and subsequently OMERO.figure.
2. Initial layout
You will automatically have 4 aligned figures.
3. Zoom to tails
For these images we are only interested in the GFP signal in the tail, while keeping the 4 images selected change the zoom to 200.
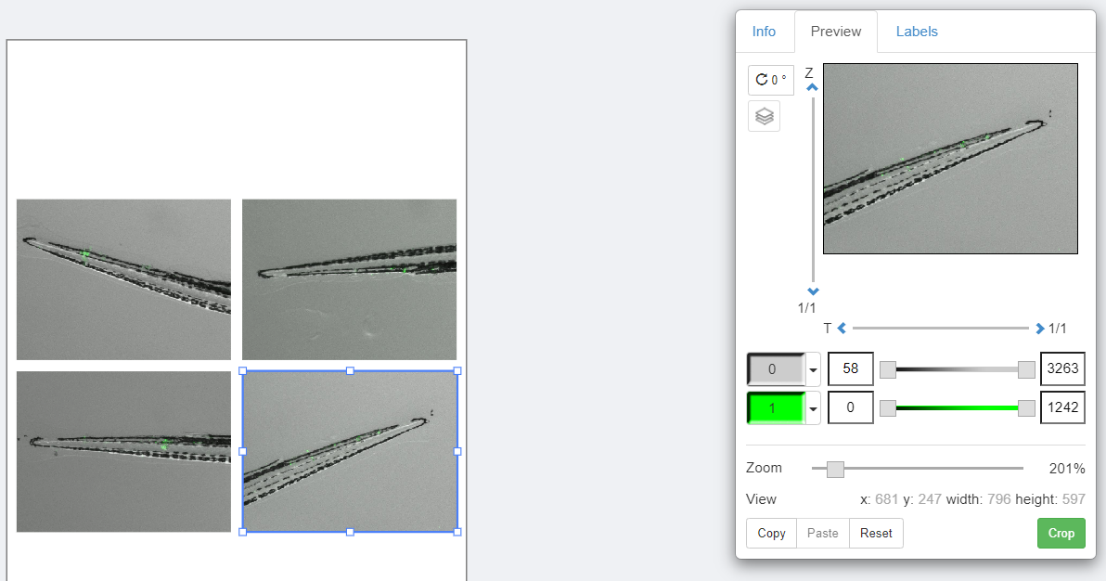
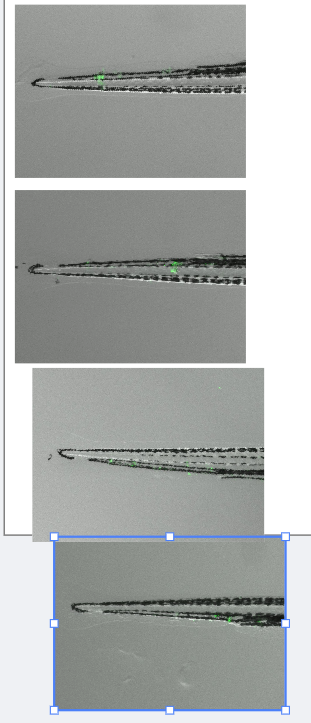
4. Position the tails
By clicking on each individual image we can move the region we want to display in the Preview screen at Right top.
5. Rotate images
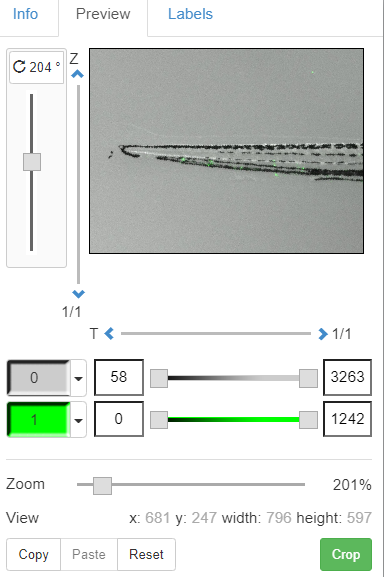
As you can see not all tails are oriented nicely, we can fix this by changing the rotation (also in the preview panel).
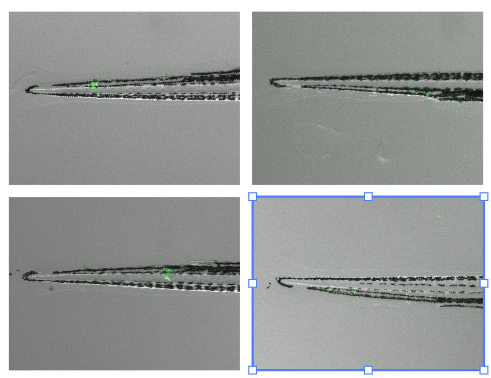
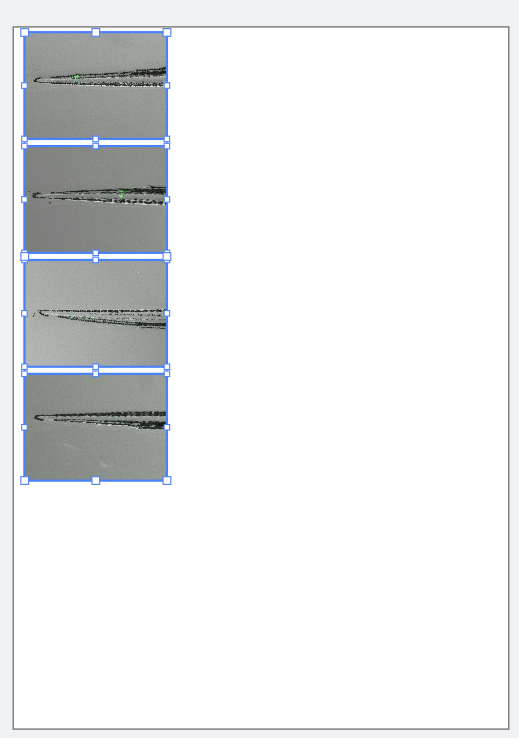
6. Check alignment
You should get 4 nicely aligned tails like this:
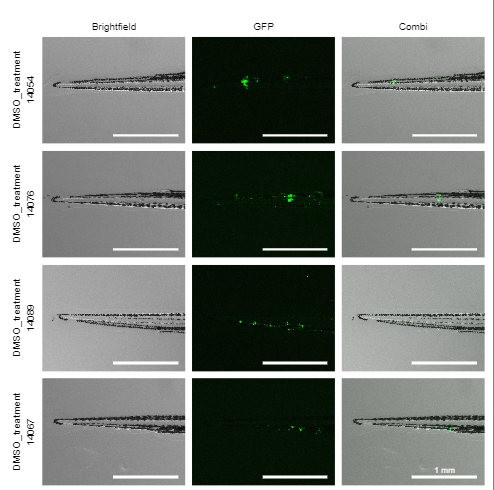
7. Create column layout
Your PI likes the image but wants to show separately the tails in brightfield, GFP and an overlay. To do this we need to copy and paste the images, and make 3 columns, first drag the two right images to the bottom to make a column of 4 images, this does not need to be perfect, like this:
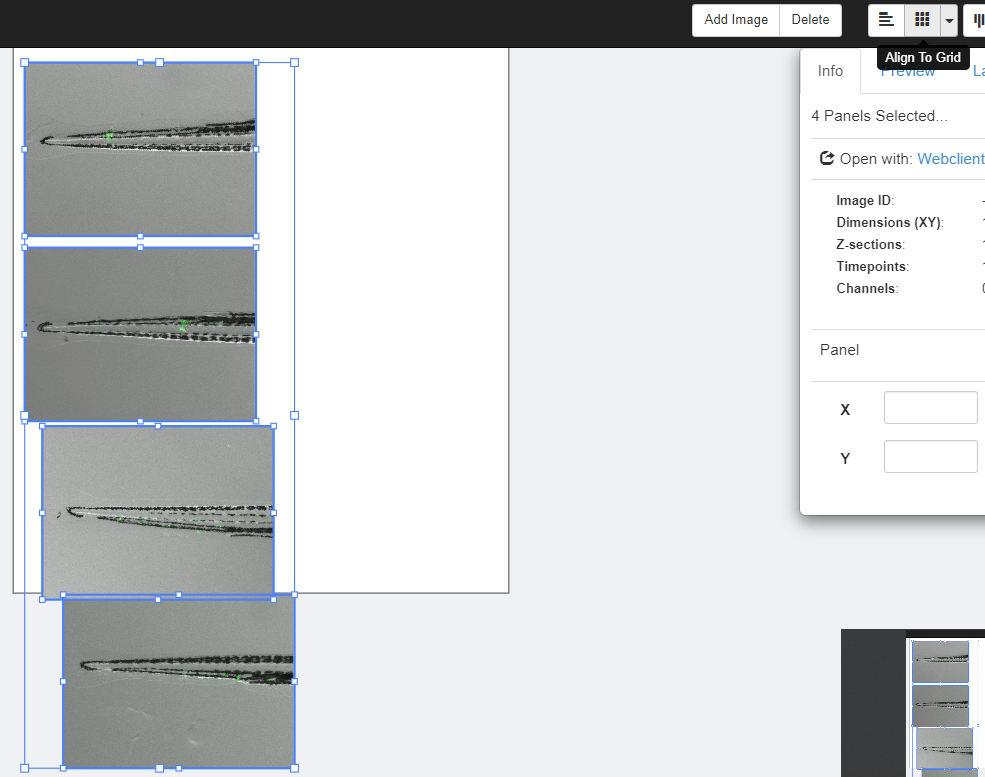
8. Align to grid
Select all images by drawing a rectangle around them, and then press align to grid on the right top.
9. Make room for columns
Like this they won’t fit in the figure, so while keeping them all selected shrink them a bit make sure there is enough room for 3 columns.
10. Copy columns
Now copy and paste them twice.
11. Configure first column: Brightfield
Select the first column and disable the green signal by pressing the green button in the preview.
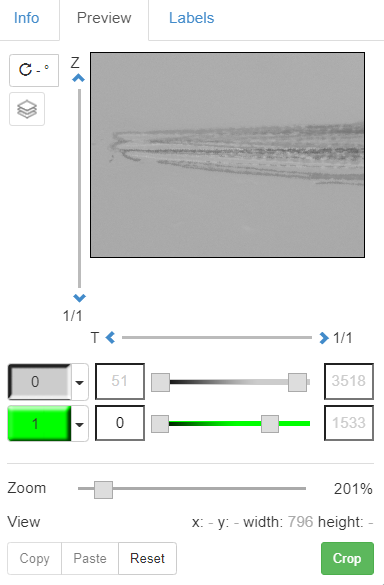
12. Configure second column: GFP
Select the second column and disable the brightfield, maybe adjust the brightness of the green signal by drawing the bar in the preview.
13. Add column header: Brightfield
Select the top left image and go to the labels, add brightfield on the top outside the image.
14. Add column headers: GFP and Combi
Repeat for the middle with GFP, and combi for the right.
15. Add row labels
Select the four left images and add another label [dataset.name], and [image.id] on the left outside.
16. Add scale bars
Select all images and add a scale bar of 1 mm, disable the label in all of them except the right bottom one.
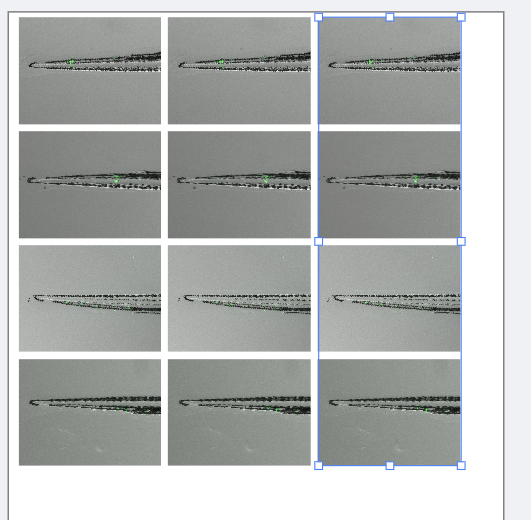
17. Final result
You should now have ended up with a nice figure like this:
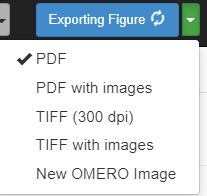
18. Save and export
Of course you want to keep this, so you can save it in OMERO.figure by pressing save. If needed for a paper you can export it in various options.