Scaling
Proper scaling is essential for accurate measurements in biological images.
1. Open Embryos Sample
File > Open Samples > embryos
2. Set the Scale
Draw a line on the scale bar in the image
Go to Analyze > Set Scale
Enter the known distance (the number of pixels is shown in the top box)
Click OK
3. Measure Embryo Area
Now you can measure the average area of embryos:
Convert to 8-bit: Image > Type > 8-bit
Apply threshold: Image > Adjust > Threshold
Fill holes: Process > Binary > Fill Holes
Separate touching embryos: Process > Binary > Watershed
Analyze particles: Analyze > Analyze Particles
Set a minimum size (e.g., 10 µm²)
Check Display results
Click OK
What is the average embryo area?
Histograms
Histograms show the distribution of pixel intensities in an image.
1. Open Sample Image
Open File > Open Samples > clown (or if you have coulrophobia, use The New lenna)
2. View Histogram
Go to Analyze > Histogram
3. Understand the Information
What do these values mean?
Count: Total number of pixels
Mean: Average pixel intensity
StdDev: Standard deviation of pixel intensities
4. RGB Histograms
Click the RGB button
Click it again
What changes do you see?
5. Color Analysis
Which color is least represented in this picture?
Counting and Segmenting
Learn how to count and segment objects in fluorescence images.
1. Open HeLa Cells
Open the HeLa cells sample image again: File > Open Samples > HeLa cells
2. Prepare the Red Channel
Split the channels: Image > Color > Channels Tool > More > Split channels
Select the red channel (mitochondria)
Subtract background: Process > Subtract background
3. Threshold and Count
Apply threshold: Image > Adjust > Threshold
Adjust the threshold to your liking
Click Apply
Count particles: Analyze > Analyze Particles
Check Add to manager
Click OK
How many objects were detected?
4. Separate Merged Objects
If you zoom in, some objects are merged together.
Separate them: Process > Binary > Watershed
Count particles again: Analyze > Analyze Particles
How many foci do you get now?
5. Find Maxima Method
An alternative method based on local intensity differences:
Load the red channel again (before thresholding)
Go to Process > Find Maxima
Adjust the Noise tolerance until no foci are missed
Check Preview to verify
How many foci are detected now?
Why is this method better than the previous ones?
Measurements
1. Prepare the Blue Channel
Switch to the blue channel (nuclei)
Create a thresholded image: Image > Adjust > Threshold
Click Apply
2. Configure Measurements
Go to Analyze > Set Measurements
Select:
Area
Feret’s diameter (longest axis)
Perimeter
Click OK
3. Measure Nuclei
Run Analyze > Analyze Particles
Make sure Display results is checked
Click OK
The results table shows measurements for each nucleus.
Segmentation and Labeling
1. ROI Interactive Filter
Go to Plugins > LeidenUniv > Teaching > ROI interactive filter
Explore the different parameters:
Which parameters distinguish merged blobs from single blobs?
Which parameter identifies homogeneous vs. variable staining?
What is the purpose of Exclude edges?
2. Understanding Measurements
When you click OK, you’ll see data for all measured objects. What do these parameters mean?
Area: Number of pixels in the object
Mean: Average intensity
StdDev: Standard deviation of intensity
Mode: Most common intensity value
Min: Minimum intensity
Max: Maximum intensity
IntDen: Integrated density (sum of all pixel values)
3. Filter Embryos
Open File > Open Samples > embryos
Convert to 8-bit: Image > Type > 8-bit
Run Plugins > LeidenUniv > Teaching > ROI interactive filter
Answer these questions:
What settings can you use to filter out doubles (touching embryos)?
What can you do to filter out empty embryos?
The Necessity of Quantitative Measurements
Visual perception can be misleading. This exercise demonstrates why quantitative measurements are essential.
1. Test Visual Perception
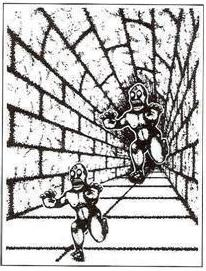
Copy this image to FIJI
Measure the length of both robots:
Draw a line along each robot
Hold Shift to keep it straight
Record the measurements (Ctrl+M)
2. Compare Measurements
How big is the difference?
Does this match your visual perception?